Sexual Identity Fluidity – The Evidence
Although many pour scorn on notions that people’s sexual identity can change, research like Jones and Yarhouse’s “Ex-Gay Study” (J&Y) demonstrate that for some who pursue a purposeful attempt to do such a thing, there is a noticeable change over time (though at the same time others do not see such change). However, given the “religious” nature of J&Y, many are quick to denounce it, claiming bias in the researchers, confirmation bias in the participants or a lack of clarity of the results (indeed some of the results in J&Y are not statistically significant).
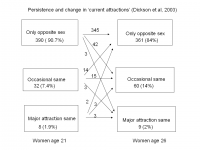
J&Y though is not the only piece of research on the subject. Whilst J&Y have examined fluidity amongst those who purposefully seek to move towards greater heterosexual functioning, other researchers have explored general sexual identity and attraction movement amongst a general population. One of the most famous of these studies is the 2003 piece by Dickson, Paul and Herbison (DP&H) where as part of a cohort study of women born 1972/1973 they explored variant sexual behaviour over time.
 The accompanying transition matrix is fascinating (click on the picture to expand). Of the 8 women who aged 21 claimed a major attraction to those of the same sex, by age 26 2 of them (25%) now claimed to be exclusively heterosexual and a further 3 (37.5%) claimed to have only occasional same sex attractions. Conversely, only 3 of the 390 women (< 1%) who reported exclusive heterosexual attractions at age 21 reported major homosexual attraction and a further 42 (just over 10%) reported some homosexual attraction.
Compare this to Mock and Eibach (M&E) reporting in 2011 on an attempt to use a 10 year US longitudinal study data set to explore the same issues. They were less interested in sexual identity / orientation transition per se and more interested in the reasons why people transited and whether specific kinds of people (i.e. based on age, marital status, educational achievement, race) were more likely to transit. The results were fascinating.
Whereas the self-reported homosexual women in the sample reported similar transitions to the women in DP&H (only 44% still classified themselves as homosexual at the second wave), the men were a completely different case. Of 21 homosexual men at wave 1, 19 were still homosexual at wave 2 with only 1 a piece reporting bisexuality or heterosexuality. That’s quite a contrast to the women. What’s going on?
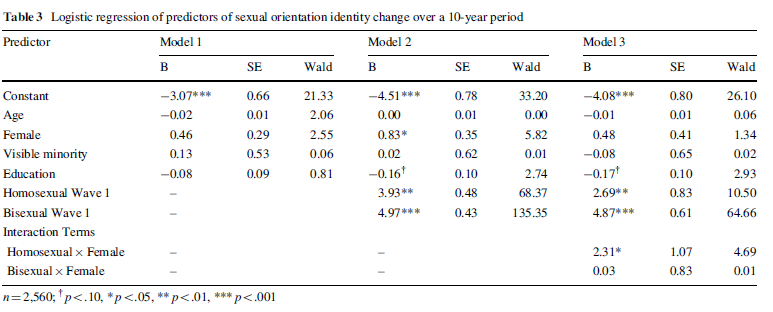
M&E used regression techniques to try and find the reasons why (if any). Here’s their results table.
Here’s how to read it. There were three models, each with an increasing number of variables examined. The numbers reported in the B column tell you what the coefficients for each factor were. For example, the -0.02 for Age in model 1 tells you that as a person gets older they are less likely to transit sexual orientation / identity. Of course it’s not quite as simple as that because we want to make sure that our model results are robust. That’s why we have significance level checks. The p<.10 checks tell us something is 90% significant, p<.05 is 95% significant and so on. We normally go for at least the 95% significance level.
So, how then to interpret what we’re seeing. The first model looks at age, sex, race and education and whilst it produces coefficients none of them are significant. Model two throws in initial sexual identity at wave 1 and now we see significant results with homosexual and bisexual identity indicating that you are much more likely to transit then if you begin with heterosexual identity. On top of that, if you are a woman you are more likely to transit given that we already know about your wave 1 identity. Does this mean that female homosexuals / bisexuals are more likely to transit then male homosexuals / bisexuals? Well model 3 explores that and, sure enough, female homosexuals show significant prevalence to transit and femaleness by itself drops out.
So what does this tell us? The fact that the wave 1 homosexual and bisexual coefficients stayed in when we introduced a homosexual female coefficient indicates that male homosexuals are still more likely to transit then male heterosexuals, but they aren’t as likely to transit as female homosexuals. The picture we build is off a bi-polar sexual orientation spectrum with transition both ways. Crucially though, transition is far more likely from homosexual / bisexual towards another orientation then from heterosexuality towards bisexuality / homosexuality. This effect is even more pronounced amongst women then men.
Academics like Lisa Diamond at the University of Utah continue to explore this phenomenon, with her latest publication arguing that male focussed models of sexuality block understanding this high fluidity in bisexual / homosexual female behaviour. An earlier piece of work in 2008 found incredible fluctuations in sexual orientation and identity amongst adolescents who originally identified as bisexual.
As the Pilling Commission explores issues around sexual orientation, identity and practice for the House of Bishops of the Church of England, research like this should be at the forefront of it’s mind when confronted by submissions from those who argue that sexual orientation and identity is immutable. The scientific evidence seems to indicate that contrary to that view, for many women and some men who experience levels of same-sex attraction, sexual identity can change significantly over time, even when there is no hint of any form of therapy having been undertaken.


0 Comments on “Sexual Identity Fluidity – The Evidence”