Multiple Aspects of Sexual Orientation
A fascinating paper from New Zealand published three years ago to add to our collection of research on sexual orientation causation. Here’s the meaty bit.
Childhood Correlates (Prior to 16 Years) and Sexuality
The association between childhood sociodemographic characteristics and sexuality groups is shown in Table 3. Because of the relationships between age, sex, and sexuality groups, each correlate was adjusted for age, sex, and an age by sex interaction.
Parental educational level was unrelated to membership of the five different sexuality groups (p=.30), but those whose parents had only primary education were slightly more likely to report being heterosexual with no same-sex experience (96.2%) than those where at least one parent had secondary education (94.5%) or tertiary education (94.2%) (p\.02 for both comparisons). Family of origin was associated with membership of different sexuality groups (p=.001) but the pattern was complicated. Compared with those brought up by both biological parents, those with a biological parent and an opposite-sex stepparent were about twice as likely to be heterosexual with same-sex experience only, whereas those brought up by two other opposite-sex parent-figures were more than twice as likely to be homosexual and marginally more likely to be bisexual. Those from single parent families did not differ in sexual orientation or behavior from those brought up by two biological parents.
The association of childhood adverse events with the sexuality groups is shown in Table 4. Physical violence either to the child or within the home was associated with an increase in the likelihood of belonging to any of the sexuality groups which were not exclusively heterosexual (overall p.008). The odds ratios were modest (1.2–2.8) and varied across the sexuality groups, although all 95% CIs overlapped considerably. Rape before age 16 and sexual assault before age 16 were more strongly associated with belonging to any of the non-exclusively heterosexual groups (OR 1.8–5.0, overall p\.0001). The presence of any other adverse event, of a possible 25 types, was only weakly associated with these sexuality groups (OR 1.1–1.8, overall p=.01). Although for any individual type of adverse event the 95% CIs overlapped extensively between the sexuality groups, it is of interest that over the five types of adverse event in Table 5, heterosexuals with a same-sex sexual relationship had higher ORs than did those with same-sex experience only, and homosexuals had lower ORs than bisexuals. However, a safer conclusion is to note that each type of adverse event was associated with an increase in the OR for each non-exclusively heterosexual sexuality group and that there were no clear-cut differences in the extent of these associations across the sexuality groups. In addition to reporting results for each type of adverse event individually, controlling for age and sex, a cumulative count was also developed. The more types of adverse events experienced in childhood, the higher the ORs for each sexuality group (the exception was the anomalously low OR for homosexuality in those who had experienced two types of adverse events). The percentage in the exclusively heterosexual group is shown for each type of adverse event or cumulated adverse event score. The more types of adverse events experienced, the lower the percentage in the exclusively heterosexual group, but even for those with three or more such types of events the great majority (80.2%) still reported exclusively heterosexual identity and behavior. For all in the sample reporting adverse events before age 16, the unweighted medians were age 7 for beatings and for other violence in the home, 9 for both sexual adverse events, and 10 for other adverse events, well before puberty or adolescence.
Here’s the data table referenced above, but it doesn’t show the non-heterosexual aggregates which are described. Click on the table for a larger version.
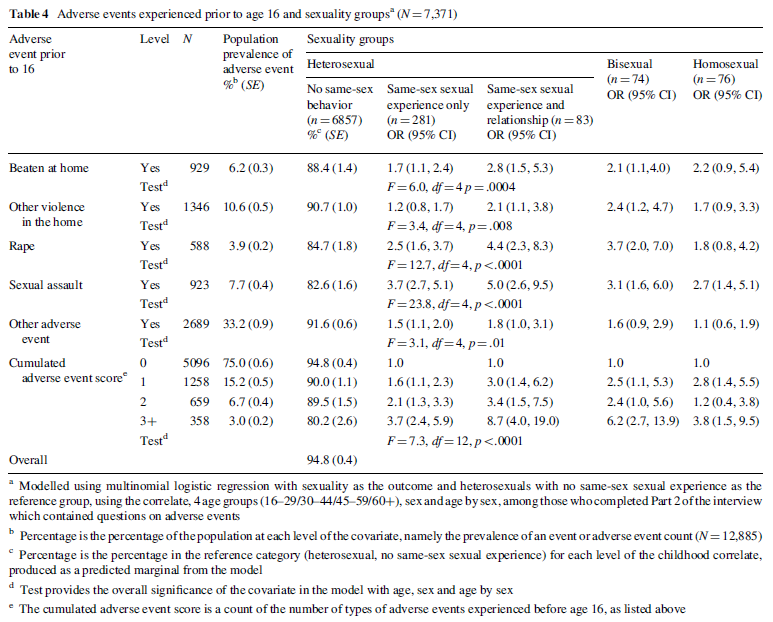 A quick guide to reading this table. We’re looking for prevalence rates for the non “completely heterosexual” groups where the 95% Confidence Intervals for the OR (basically the ratio of the likelihood of the observed phenomena occurring in the “non-straight” group compared to the “completely heterosexual group) lie outside 1. So, look at line 2 (“Other violence in the home”). The “Same-sex sexual experience only” group has an OR of 1.2, indicating that in this group 20% more respondents had experienced other violence in the home. But the 95% Confidence Interval bounds are 0.8 and 1.7 so it could be that the rate is actually only 80% of that found in the “straight” group. On this basis we reject the idea there is any difference between the two groups. Now move one along and you’ll see for the “Same-sex sexual experience and relationship” group the lower bound of the CI is 1.1, so we are confident that there is a significant difference.
But did you notice the subtlety here? The two groups we looked at were not those who identified as bisexual or homosexual – they were those who identified as heterosexual but had had some kind of homosexual experience or relationship. Interesting….
Look at the last column. The only adverse effect that appears to affect the development of a strictly homosexual identity is sexual assault (but not rape). Compare this to the “straight but done some gay things” groups and it seems that almost all the adverse effects mean you are more likely to have “experimented” (for want of a better word).
So what can we say from this? Any of these adverse events make you more likely to either identify as “non-straight” or have experienced some kind of same-sex behaviour (which is interesting in and of itself). However, for the “non-straight” group the effect is far more pronounced for those who identify as bisexual than those who identify as homosexual.
Also, from the bottom of the table we can see that when you look at any adverse event there is a significant effect apart from for two events (and interestingly for that number of adverse effects the bisexual group is right on the cusp of the acceptable Confidence Interval). You would expect to see the rising OR values that you do in the “straight but done gay things” group for increased adverse effects but you don’t see that for either the bisexual or homosexual groups and that makes me wonder whether we can trust that bit of the data. A repeat study would be interesting.
In summary, we can say with confidence that a number of adverse childhood effects seem to increase the likelihood that a child will identify in adulthood as bisexual or will identify as heterosexual but will report same-sex experiences and relationships. We see hints of the same pattern with those who formally identify as homosexual but it is less apparent and further research would help to clarify. What we could be observing is an effect that makes any kind of homosexual experience or identity more likely or it could be that it is a particular effect in “straight” people (giving them a tendency to engage in homosexual activity) but it is not such a pronounced effect in those who are naturally homosexual (though this appears less likely).
One thing is for sure, the research does not tell us why such adverse effects lead to same-sex experiences or bisexual (or homosexual) identity.
I’ve uploaded the whole paper here so you can read it yourself.
Discuss!
Interesting correlations of orientation with sexual assault. While there is no proof of causality, it echoes the Steed/Templer study: Gay Men and Lesbian Women with Molestation History: Impact on Sexual Orientation and Experience of Pleasure. http://www.benthamscience.com/open/topsyj/articles/V003/36TOPSYJ.pdf
As I’ve commented on another thread: ‘While it resists any inference of causality, the study states: ‘Perhaps the most salient finding is that 68.0% of the gay men and 66.7% of the lesbian women who had been homosexually molested maintained it had an impact on their sexual orientation. Although it is an important finding, it is not known what various participants meant by “impact. It should be borne in mind that 52.9% of the men and 41.5% of the women reported impact from heterosexual molestation.’
A few thoughts:
– the para beginning “Childhood adversity has been shown to
be associated with adult sexual orientationâ€, with its references to various
studies, is very important. It tells strongly against the universal ‘born
gay’ notion and the RCPsychiatrists position that: “… there is no substantive
evidence to support the suggestion that the nature of parenting or early childhood experiences play any role in the formation of a person’s fundamental heterosexual or homosexual orientation.â€
– with such a large sample, it’s a pity that male and female weren’t analysed separately.
– Wilson and Widom, whom they cite, found that men with histories of childhood sexual abuse – but not women or men who were physically but not sexually abused – were significantly more likely than controls to report same-sex sexual partners. It would have been good if Wells et al had analysed physical and sexual abuse separately.
– Peter, you say, “The only adverse effect that appears to affect the development of a strictly homosexual identity is sexual assault (but not rape).†I wonder if many of the survey respondents could distinguish competently between these two categories. In my
ignorance or innocence I couldn’t myself. Rather than contrast them, I’d lump them together and get an unambiguous correlation between sexual assault/ rape and HS identification.
– you say we “*reject* the idea there is any difference between the two groups†if the lower CI figure is less than 1. But do we not rather say that “we have lower
than 95% confidence that this is a true reading�
– the categories of numbers of adverse events (1, 2 or 3+) struck me as a bit naive. I would suggest something more like 1-4 (= got away from it early on); 5-10 (=stayed
with it or couldn’t get away for a while); 11-50 (=medium term involvement) and >50 (long term involvement). I think that in the grand scheme of things what may be significant is not the difference between 1, 2 or 3, but the difference between 1-3 and over 50.
Yes, a very worthwhile study to tuck away.