Where are UKIP’s votes coming from?
Inspired by a post on Political Betting over Christmas, I thought it would be interesting to look at the rise of UKIP in the polls over 2012 and to see whether the claim that UKIP voters were mainly switching from the Conservatives had any merit.
I’ve taken all of the ComRes surveys in 2012 and analysed the figures, running stepwise and multiple regressions on both the raw polling figures and logarithms of the figures. The results are interesting.
Preliminary Observations
There are clear differences between the UKIP votes recorded in online and phone polls. The chart below shows the variance in support registered for UKIP depending on what kind of poll was conducted.
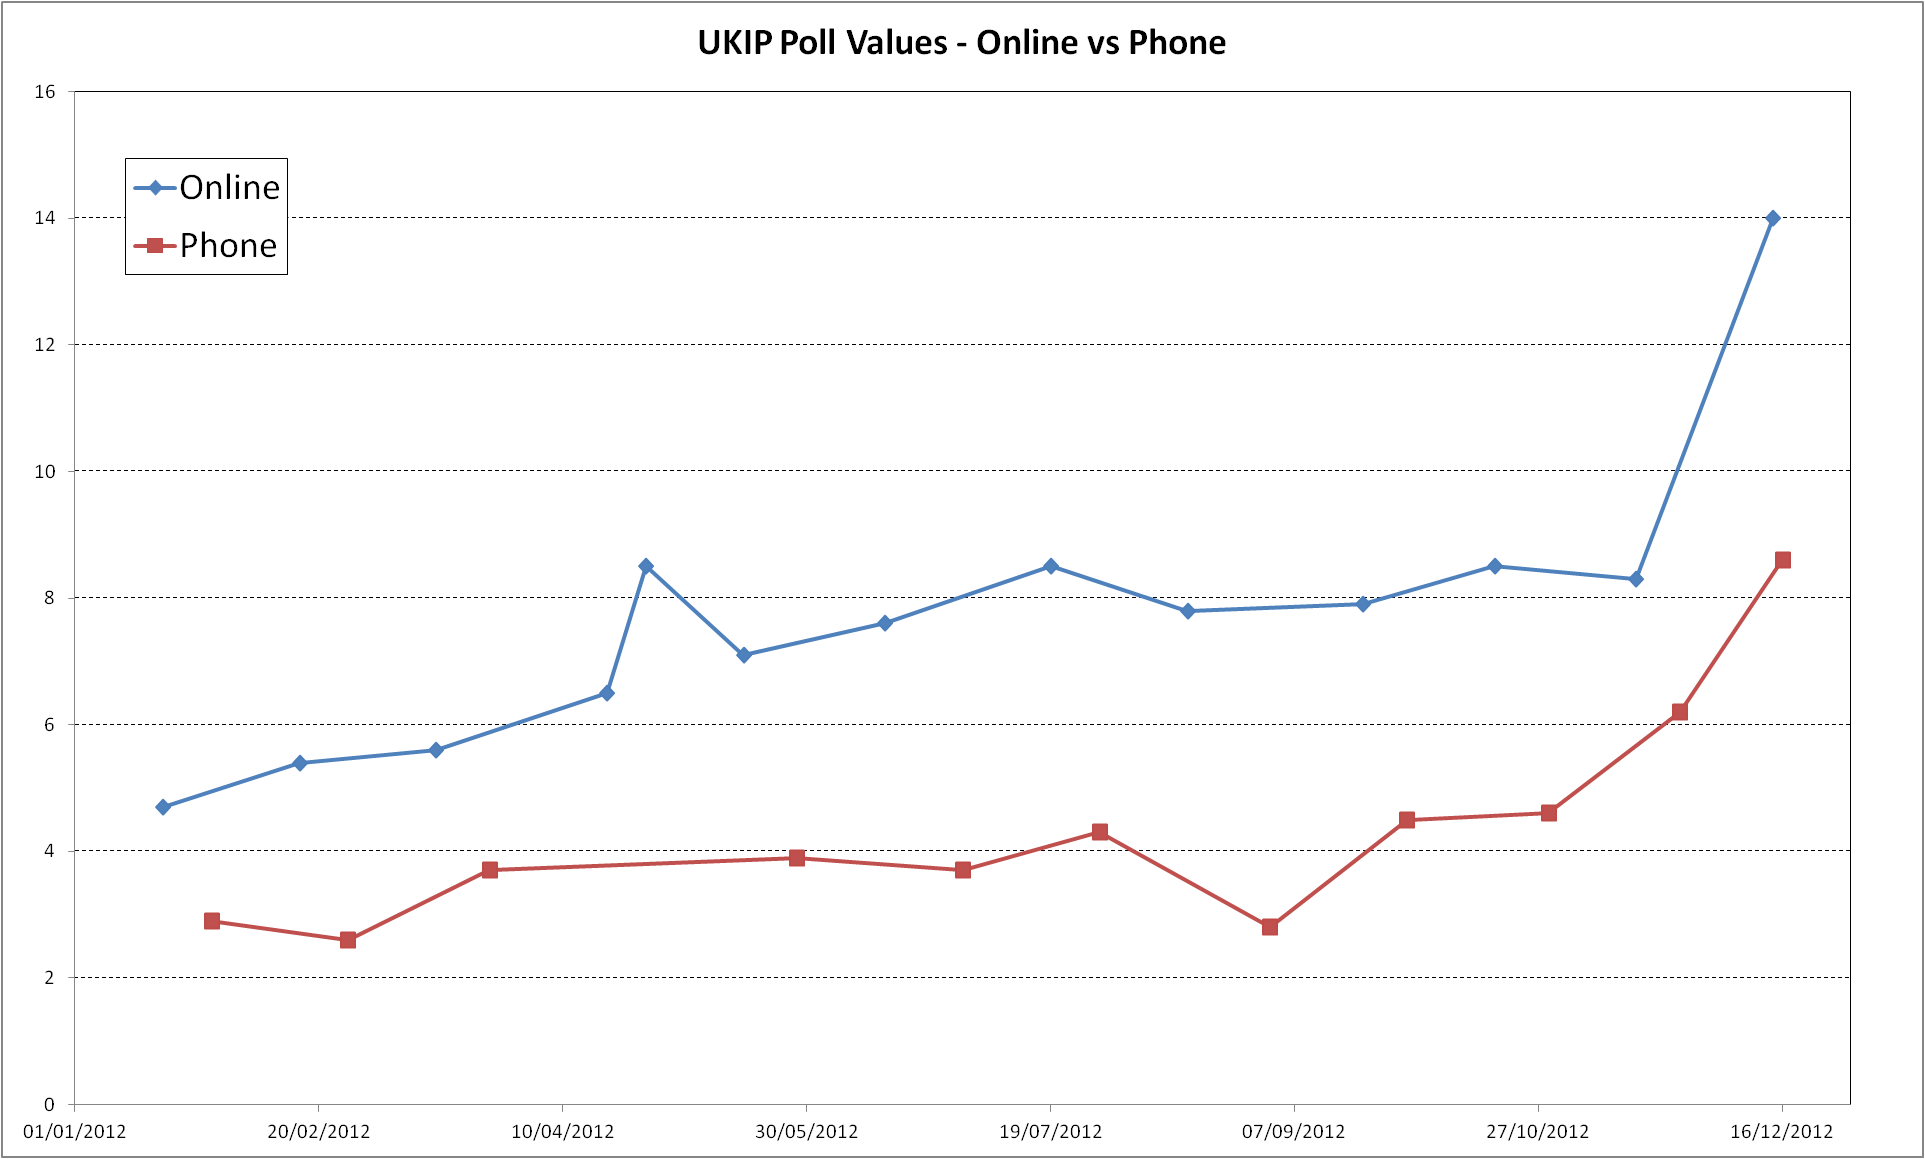 What are the reasons for this difference? Well, it might be as simple as the fact that for an online poll the interviewee is faced with a visual list of the parties to choose from and this prompts a higher rate for UKIP. Compare this to the telephone question which asks “If there was a general election tomorrow, would you vote Conservative, Labour, Liberal Democrat or some other party?”. UKIP are not explicitly named and so interviewees would have to be far more intentional in saying they would vote for UKIP (as opposed to choosing them from a list). It is only if the interviewee answers “some other party” that a further list is given which includes UKIP.
The differences in these polls therefore lends our investigation to split out ComRes’s phone and internet polls and to examine them separately to see if we can identify any trends.
Phone Polls
I ran a multiple linear regression (calculating co-efficients for all variables at the same time) on the 2012 poll results and this provided only one statistically significant (p < 0.05) value, namely the date (alongside the constant). What this indicates is that for the phone polls, the rise in UKIP votes seems to be entirely a chronological phenomenon (the UKIP vote rose over the year by 0.0117% per day) – what we are seeing is a general rise in UKIP support over the year and not a specific Tory votes become UKIP votes pattern. Indeed, for phone poll UKIP interviewees, there is a much stronger statistical relationship with the level of support for Labour or the Liberal Democrats then with the Conservatives.
| Results of multiple regression for UKIP | |||||||
| Summary measures | |||||||
| Multiple R | 0.8905 | ||||||
| R-Square | 0.7930 | ||||||
| Adj R-Square | 0.6551 | ||||||
| StErr of Est | 1.0204 | ||||||
| ANOVA Table | |||||||
| Source | df | SS | MS | F | p-value | ||
| Explained | 4 | 23.9395 | 5.9849 | 5.7475 | 0.0300 | ||
| Unexplained | 6 | 6.2478 | 1.0413 | ||||
| Regression coefficients | |||||||
| Coefficient | Std Err | t-value | p-value | Lower limit | Upper limit | ||
| Constant | -451.8108 | 140.5543 | -3.2145 | 0.0183 | -795.7348 | -107.8868 | |
| Date Num | 0.0117 | 0.0034 | 3.4381 | 0.0138 | 0.0034 | 0.0201 | |
| Con | 0.0103 | 0.1890 | 0.0547 | 0.9582 | -0.4521 | 0.4728 | |
| Lab | -0.4145 | 0.2070 | -2.0022 | 0.0921 | -0.9211 | 0.0921 | |
| LD | -0.7339 | 0.3344 | -2.1947 | 0.0706 | -1.5521 | 0.0843 | |
I confirmed the primary statistical link to the date of the poll and not to the rise or fall in other by running a stepwise regression (0.05 in, 0.1 out) on the same data. No other variables came in to the model after the date field. I then repeated both regressions using logarithms of the explanatory variables – the results were the same.
What can we surmise from this? Remember, when ComRes conduct a phone poll they simply ask which party the interviewee intends to vote for without prompting party names. Our analysis indicates that when answering this question the rise over the year of support for UKIP is mainly a chronological function – the rising support for UKIP does not appear to be statistically linked to the decline in support for another party. Indeed, the most obvious candidate for such a relationship (the Conservatives) had the least significant relationship with the level of UKIP support (p = 0.9582). Rising UKIP support in phone polls during 2012 appears to be a generic phenomenon with no direct link to switching from a particular political party.
Internet Polls
Now we turn to examining the poll data from ComRes’s online polls and they show a slightly different picture. Remember, in these polls the interviewee is presented with a list of parties on their screen and that includes UKIP.
Multiple Linear Regression produces the following table.
| Results of multiple regression for UKIP | |||||||
| Summary measures | |||||||
| Multiple R | 0.9878 | ||||||
| R-Square | 0.9757 | ||||||
| Adj R-Square | 0.9635 | ||||||
| StErr of Est | 0.4359 | ||||||
| ANOVA Table | |||||||
| Source | df | SS | MS | F | p-value | ||
| Explained | 4 | 61.0029 | 15.2507 | 80.2601 | 0.0000 | ||
| Unexplained | 8 | 1.5201 | 0.1900 | ||||
| Regression coefficients | |||||||
| Coefficient | Std Err | t-value | p-value | Lower limit | Upper limit | ||
| Constant | -188.9435 | 93.2430 | -2.0264 | 0.0773 | -403.9622 | 26.0751 | |
| Date Num | 0.0063 | 0.0022 | 2.8785 | 0.0206 | 0.0013 | 0.0114 | |
| Con | -0.6793 | 0.0750 | -9.0588 | 0.0000 | -0.8522 | -0.5063 | |
| Lab | -0.7784 | 0.1008 | -7.7241 | 0.0001 | -1.0108 | -0.5460 | |
| LD | -0.8997 | 0.2617 | -3.4380 | 0.0089 | -1.5031 | -0.2962 | |
This is really interesting! All variable p-values are significant and we see that there are clear relationships not just chronologically as with phone polls but with support rising for UKIP in direct relationship to support declining for other parties. In order to explore this further I conducted stepwise regression.
| Results of stepwise regression for UKIP | |||||||
| Step 1 – Entering variable: Con | |||||||
| Summary measures | |||||||
| Multiple R | 0.8400 | ||||||
| R-Square | 0.7056 | ||||||
| Adj R-Square | 0.6788 | ||||||
| StErr of Est | 1.2936 | ||||||
| ANOVA Table | |||||||
| Source | df | SS | MS | F | p-value | ||
| Explained | 1 | 44.1153 | 44.1153 | 26.3622 | 0.0003 | ||
| Unexplained | 11 | 18.4078 | 1.6734 | ||||
| Regression coefficients | |||||||
| Coefficient | Std Err | t-value | p-value | Lower limit | Upper limit | ||
| Constant | 29.8100 | 4.3167 | 6.9058 | 0.0000 | 20.3090 | 39.3109 | |
| Con | -0.6549 | 0.1276 | -5.1344 | 0.0003 | -0.9357 | -0.3742 | |
| Step 2 – Entering variable: Lab | |||||||
| Summary measures | Change | % Change | |||||
| Multiple R | 0.9221 | 0.0821 | 9.8% | ||||
| R-Square | 0.8503 | 0.1447 | 20.5% | ||||
| Adj R-Square | 0.8204 | 0.1416 | 20.9% | ||||
| StErr of Est | 0.9674 | -0.3262 | -25.2% | ||||
| ANOVA Table | |||||||
| Source | df | SS | MS | F | p-value | ||
| Explained | 2 | 53.1652 | 26.5826 | 28.4065 | 0.0001 | ||
| Unexplained | 10 | 9.3579 | 0.9358 | ||||
| Regression coefficients | |||||||
| Coefficient | Std Err | t-value | p-value | Lower limit | Upper limit | ||
| Constant | 64.9459 | 11.7506 | 5.5270 | 0.0003 | 38.7640 | 91.1279 | |
| Con | -0.8751 | 0.1188 | -7.3669 | 0.0000 | -1.1397 | -0.6104 | |
| Lab | -0.6880 | 0.2213 | -3.1098 | 0.0111 | -1.1810 | -0.1951 | |
| Step 3 – Entering variable: LD | |||||||
| Summary measures | Change | % Change | |||||
| Multiple R | 0.9749 | 0.0528 | 5.7% | ||||
| R-Square | 0.9505 | 0.1002 | 11.8% | ||||
| Adj R-Square | 0.9340 | 0.1136 | 13.8% | ||||
| StErr of Est | 0.5864 | -0.3810 | -39.4% | ||||
| ANOVA Table | |||||||
| Source | df | SS | MS | F | p-value | ||
| Explained | 3 | 59.4285 | 19.8095 | 57.6124 | 0.0000 | ||
| Unexplained | 9 | 3.0946 | 0.3438 | ||||
| Regression coefficients | |||||||
| Coefficient | Std Err | t-value | p-value | Lower limit | Upper limit | ||
| Constant | 78.9319 | 7.8404 | 10.0673 | 0.0000 | 61.1957 | 96.6682 | |
| Con | -0.8286 | 0.0728 | -11.3785 | 0.0000 | -0.9933 | -0.6639 | |
| Lab | -0.7496 | 0.1349 | -5.5570 | 0.0004 | -1.0547 | -0.4444 | |
| LD | -1.2877 | 0.3017 | -4.2680 | 0.0021 | -1.9702 | -0.6052 | |
| Step 4 – Entering variable: Date Num | |||||||
| Summary measures | Change | % Change | |||||
| Multiple R | 0.9878 | 0.0128 | 1.3% | ||||
| R-Square | 0.9757 | 0.0252 | 2.6% | ||||
| Adj R-Square | 0.9635 | 0.0295 | 3.2% | ||||
| StErr of Est | 0.4359 | -0.1505 | -25.7% | ||||
| ANOVA Table | |||||||
| Source | df | SS | MS | F | p-value | ||
| Explained | 4 | 61.0029 | 15.2507 | 80.2601 | 0.0000 | ||
| Unexplained | 8 | 1.5201 | 0.1900 | ||||
| Regression coefficients | |||||||
| Coefficient | Std Err | t-value | p-value | Lower limit | Upper limit | ||
| Constant | -188.9435 | 93.2430 | -2.0264 | 0.0773 | -403.9622 | 26.0751 | |
| Con | -0.6793 | 0.0750 | -9.0588 | 0.0000 | -0.8522 | -0.5063 | |
| Lab | -0.7784 | 0.1008 | -7.7241 | 0.0001 | -1.0108 | -0.5460 | |
| LD | -0.8997 | 0.2617 | -3.4380 | 0.0089 | -1.5031 | -0.2962 | |
| Date Num | 0.0063 | 0.0022 | 2.8785 | 0.0206 | 0.0013 | 0.0114 | |
We can now see the order in which the different explanatory variables come in. First is the Conservative poll value, then the Labour value, then the Liberal Democrat value and finally the date (the final stepwise model is identical to the multiple linear model). What does this tell us?
The obvious interpretation is that when interviewees are given a clear choice of parties to choose from their response to the poll is different. One might visualise it like this – a Conservative voter dissatisfied with current policies when asked who (s)he will vote for might respond “Conservative”, but when prompted with a list of parties might provoke him/her to think “Well normally I would vote Conservative but actually I’m going to vote UKIP”. There appears to be a clear statistically significant effect of vote transfer from all three parties when UKIP is named in the list of parties to choose from. The effect is most powerful amongst Conservative voters but it is also present from other parties. It is certainly much more powerful then the simple chronological effect identified in the phone polls.
Summary
We can summarise these findings as follows. There was a small underlying rise in the support for UKIP that was not linked to support transfer from any particular party (or may alternatively represent an increasing likelihood of voters to transfer allegiance to UKIP over the year). However, on top of this generic rise in support, when voters are given a specific choice of parties to choose from which includes UKIP, we see evidence of specific support transfer from other parties that is statistically significant. We build up a picture of UKIP support rising through specifically intended transfers of support from other parties when interviewees are prompted to consider them as an option to vote for and that transfer of support comes from all three main parties.
Put even simpler, when UKIP are mentioned as a specific choice, their support increases in direct relationship to decreasing support for other parties. When they are not specifically mentioned as a voting option this phenomenon disappears and is replaced by a unique chronological relationship. The vote transfer when prompted effect is much much stronger then the base chronological effect we see in the phone polls (phone polls model adjusted R-Squared = 0.6551 , internet polls model adjusted R-Squared = 0.9635).
The next step to analyse this effect would be to see if it was present in other Polling Agency’s figures where they conduct both phone and internet polls. We would also be interested in doing some qualitative research looking at the reasons why people chose to vote UKIP and exploring whether they varied depending both on the source of the poll (phone or internet) and which party they were transferring support from.
One thing is clear though – the growth in UKIP support is not simply a case of disillusioned Conservative voters finding a party to register their protests with – the rise in UKIP over 2012 has seen votes transferred from a number of sources. For example, page 13 of the latest ComRes internet poll indicates that less than 40% of those who expressed support for UKIP identify themselves as natural Conservative voters. Food for thought as both Cameron and Farage plot their strategy for garnering votes over the next two years.
Peter, do the actual coefficients tell us anything? For example, does -0.68 for Conservative vs -0.78 for Labour mean that someone switching from Conservative is less likely to change to UKIP than someone switching from Labour? Also, what does the trend look like for Conservative and labour votes look like over the year?
What it tells us is that for every 1% the Tory vote share drops, the UKIP vote share goes up by 0.68%. For every 1% the Labour vote goes down the UKIP vote goes up by 0.78%. However the converse is true – if the Labour vote goes up by 1% the UKIP vote goes down by 0.78%. It’s not accurate to read these as strict “likelihood to transfer vote” though.
As for what happens to the votes, download the spreadsheet at the bottom of the post and you can see for yourself.
The reality is that there appears to be an age correlation on the issue of gay marriage. It would be interesting to correlate the likely vote of each MP: http://www.c4em.org.uk/support-for-equal-marriage/ with the age distribution of his/her constituents: http://www.ageuk.org.uk/documents/en-gb/for-professionals/government-and-society/quantifying_the_changing_age_structure_of_the_british_electorate_2005_2025_researching_the_age_demographics_of_the_new_parliamentary_constituencies_2009_pro.pdf?dtrk=true
Any savvy campaigner for traditional marriage could link efforts to change to the institution of marriage to a growing marginalisation of those opinions represented by older voters. Pension rights, ageism in the workplace and now even traditional marriage. He would say that the emphasis is reflected in the conscious political effort to rid party representation for older representatives as a basis for securing its long-term future with younger voters, He would canvass the older members of each constituency on the issue of ageist policies.
He would procure a list of the 80 most marginal seats (here): http://www.telegraph.co.uk/news/politics/9602029/The-80-most-marginal-seats.html and compare it with the MPs expressed support for gay marriage (here): http://u-church.blogspot.co.uk/2013/01/list-of-mps-in-80-most-marginal-seats.html. He would make it a key issue in debates.
Is it any wonder that one of the MPs in a marginal seat with a higher than average proportion of over 55 voters, Sarah Newton, MP for Truro, is holding a couple of public meetings on 18th January to gauge voter concern on this issue? The South-West, with low majorities and an ageing electorate is the political battle-ground for this issue.
Even the Coalition for Marriage realise that: http://c4m.org.uk/2013/01/one-million-leaflets-sent-to-marginal-seats-over-redefining-marriage/
There you go!