Like a Blanket of Snow – Why UKIP did so Poorly
 Given the kind of headlines we’ve had over the past 48 hours, I wanted to explore why it was so hard to predict how many seats UKIP would have picked up on Thursday. If you look down my blog, you’ll see that I made a bold prediction of huge UKIP gains, but in the event they won a little under 150 seats despite out-polling Labour and the Liberal Democrats (and doing even better vote wise then ComRes predicted). Why did they do so poorly? Why did I over-forecast so much?
The answer is surprisingly perverse – UKIP are not very good at fighting elections. At first this seems like a bizarre statement given what we have seen on Thursday and Friday, but bear with me and I will prove my point.
To explore the UKIP performance I looked at the individual ward results here in my home county of Kent. I split the overall data up into two sub-population – firstly seats where UKIP fought in 2009 and fought in 2013 and secondly seats where UKIP didn’t fight in 2009 but fought in 2013. The difference are staggering.
| 2009 | 2013 | Vote Increase |
|
| Share of the Vote Overall | 6.2% | 26.6% | 20.4% |
| Share of the Vote No UKIP 2009 | 0% | 27.5% | 27.5% |
| Share of the Vote UKIP 2009 | 17.3% | 30.5% | 13.2% |
This is a fascinating table. What it tells us is that where UKIP had fought before in 2009 it achieved less than half as large an increase in it’s share of the vote as those seats where it was standing for the first time? Given that forecasts are normally based on assuming a roughly uniform movement of votes across all seats, you can see how easy it was to over-forecast how well UKIP would do. I assumed that the UKIP vote would act pretty much the same everywhere and that some regional improvements in one area would be balanced out by regional poor performances elsewhere. And of course this happened, so for example in counties like Somerset UKIP did really badly and in other places like Norfolk they did really well.
However this is besides the point – we expect these variations to happen. What we don’t expect is for the party to not do better in seats it already has presence in when compared with seats it is fighting for the first time. Think of it this way – in a General Election where Labour has 20% of the vote in one seat and 40% of the vote in another you would expect both seats to move about the same, so if in the first seat Labour increased it’s share to 25% you would expect it to increase it’s share in the second seat to around 45%. What you wouldn’t expect is for in all the seats where it previously had 20% of the vote for it to increase to 45%, but in the seats where last time it had 40% of the vote for it to also only increase to 45%.
But this is exactly what UKIP have done. The effect of their votes is like snow falling on a zig-zag roof or a field with lots of mole-hills. At first the snow falls uniformly everywhere – the contours of the surface underneath are still easily visible. However, as time falls and the snow continues laying on the ground inch by inch the contours begin to vanish. Soon it’s pretty hard to see where the mole-hills or points on the roof were, the sight is just of a flat blanket of snow. In the same way, on Thursday the swing to UKIP didn’t lead them to capitalising on previous ground captured at all well.
It’s pretty easy to see why my predictions were so far out. I was expecting a national UKIP uplift of over 22%, whereas in fact where they already had votes the uplift was barely over half of that. I completely overestimated the rise in support in the naive expectation that UKIP would perform in a similar manner to other political parties.
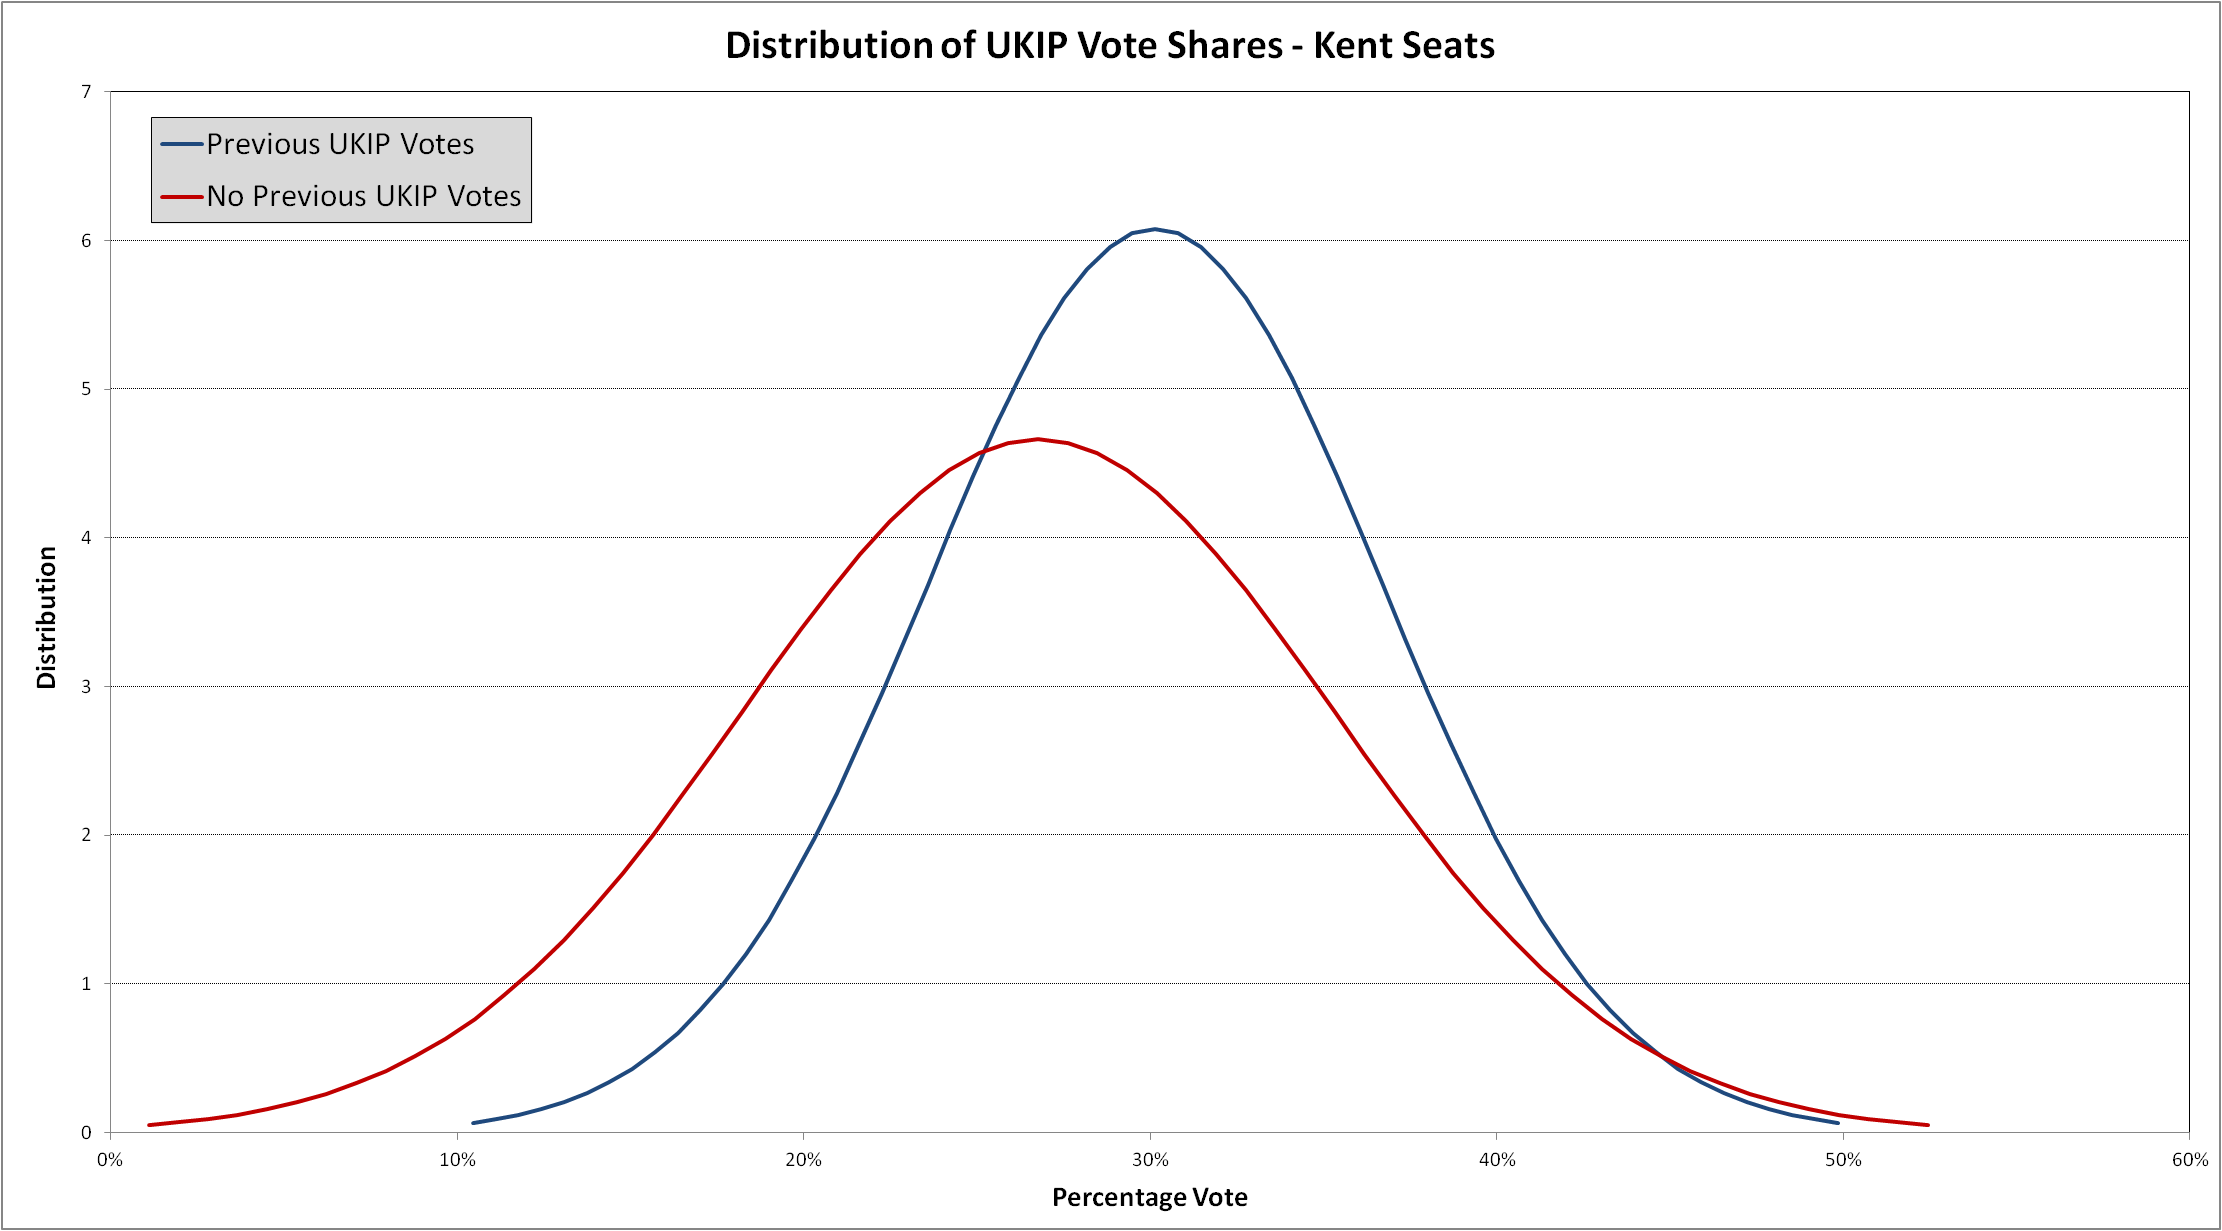 A little bit of statistical analysis can help us further. Looking at the confidence intervals of the average UKIP vote shares for the two types of seats we are looking at, we can see that the two means of the percentage of votes polled in each seat are so close together that we have to treat them as pretty much the same population. Put another way, even though UKIP got, on average, a larger percentage of the vote in seats it fought previously in 2009 compared to those it fought for the first time in 2013, the difference between those two averages is not large enough to say that there are two different groups of seats.
| Lower 95% Conf Level |
Mean | Upper 95% Conf Level |
|
| UKIP Vote 2013 – Not contested 2009 | 24.1% | 26.8% | 29.4% |
| UKIP Vote 2013 – Contested 2009 | 27.4% | 30.1% | 32.9% |
The upshot of this is that we can declare there is no significant statistical difference between the way UKIP performed in seats it contested for the first time in 2013 when compared to those it contested back in 2009. In particular, there was practically no advantage to UKIP despite the fact it already had a vote base in seats, even when it polled particularly well in those seats. It was as though it started all over again in those seats it fought back in 2009.
Why is this? There may be a number of reasons.
 It could simply be down to the fact that UKIP started with having contested so few seats in 2009 that most of the effort had to go into the new seats. In our Kentish sample 24 seats were contested by UKIP in 2009 and 2013 compared with 42 in 2013 alone.
- It could be because UKIP has very little actual active electioneering membership presence on the ground. Most political parties have well organised campaigning teams and know how to distribute campaign literature, canvass voters and concentrate on getting out those people most likely to vote for them. This helps them take the best advantage of national changes in mood. Where a party does not have local members willing to do this then they are reliant simply upon national publicity.
- There might be a natural ceiling in UKIP support that means that swing is much more sticky about the 25% mark
Regardless, the data from Kent raises a number of issues for UKIP. Although they can galvanise large public support as a vehicle of protest, there is a question as to how effectively they can actually use and concentrate that support. The data also raises the issue as to how effectively UKIP can build on previous support – the figures from the seats they fought in 2009 suggest that there was almost no “gradual improvement” on previous gains and that rather they effectively started again even where they had stood four years ago.
My data is available to download here.
In particular, there was practically no advantage to UKIP despite the
fact it already had a vote base in seats, even when it polled
particularly well in those seats. It was as though it started all over
again in those seats it fought back in 2009.
Why is this?
People who have seen UKIP in action realise that once they get a sniff of power they are no different from any other politicians.
Snow has a habit of melting pretty fast in the UK. There’s not enough substance to UKIP for them to last much longer than their crypto-fascist brethren in the BNP and EDL – who were wiped out on Thursday.
All very interesting but the fact is the country’s top psephological experts, Rallings and Thrasher, predicted UKIP would receive a projected share of 11% a few days before the election and they actually got 22%.
Not so sure what that has to do with my analysis. ComRes also made a prediction and they were almost spot on.
Peter, I disagree with this analysis, for two main reasons:-
1. One is mathematical. There is nothing strange about achieving your biggest percentage increases in seats you didn’t stand in previously. If your starting point is zero, then the only way you can go is up. There is almost certainly a vote for UKIP of 10-15% in any division they care to stand in.
2. The other is that prior to May 3rd, (and four years ago in particular) UKIP didn’t actually know where their strongest areas of support were. Until very recently, the assumption was that the average UKIP voter was a traditionalist Conservative who didn’t like Cameron. Although that is an important element among UKIP support, it’s now clear that UKIP support is more diverse than that, and in particular, is concentrated among voters on low to medium incomes.
Surely the only conclusion we can draw is that UKIP would have got about 15% of the vote had they had a candidate in those seats where it didn’t stand in 2009. Whether those voters voted elsewhere on not at all we will never know but if we put this assumed vote share into the swing calculations it all makes more sense.